
To have a 3D look at the Past Vortex click here

PAGE UNDER CONSTRUCTION
This is the set up from Friday 18th July 2014. All screen shots are from http://earth.nullschool.net;
Surface Temperature

850hpa
850 hPa level is roughly at 1.5 km, [about one mile or usually above the atmospheric boundary layer. That means there is no diurnal [day/night] temperature variation, and the underlying surface such as cool sea doesn’t affect it’s temperature. That is why 850 hpa temperature is used to distinguish air masses and thus to locate cold and warm fronts.

500hpa
Some of the highest skydives are from this level.
On average this level is around 5.5 km [18,000 ft] above sea level, and it is often referred to as a steering level, because the weather systems beneath, near to the Earth’s surface, roughly move in the same direction as the winds at the 500 hPa level.

250hpa
The height of the jet stream.

The jet stream consists of ribbons of very strong winds which move weather systems around the globe. Jet streams are found 9-16 km above the surface of the Earth, just below the tropopause, and can reach speeds of 200 mph.
How does the jet stream affect the weather?
The position of a jet stream varies within the natural fluctuations of the environment. They are caused by the temperature difference between tropical air masses and polar air masses. What happens in one part of the world depends on what is happening elsewhere – the atmosphere is a complete environment with numerous connections.
Waves or ripples along the jet stream can cause Atlantic depressions to deepen explosively as they are steered towards the UK, so they are very important to meteorologists.
http://www.metoffice.gov.uk/learning/wind/what-is-the-jet-stream
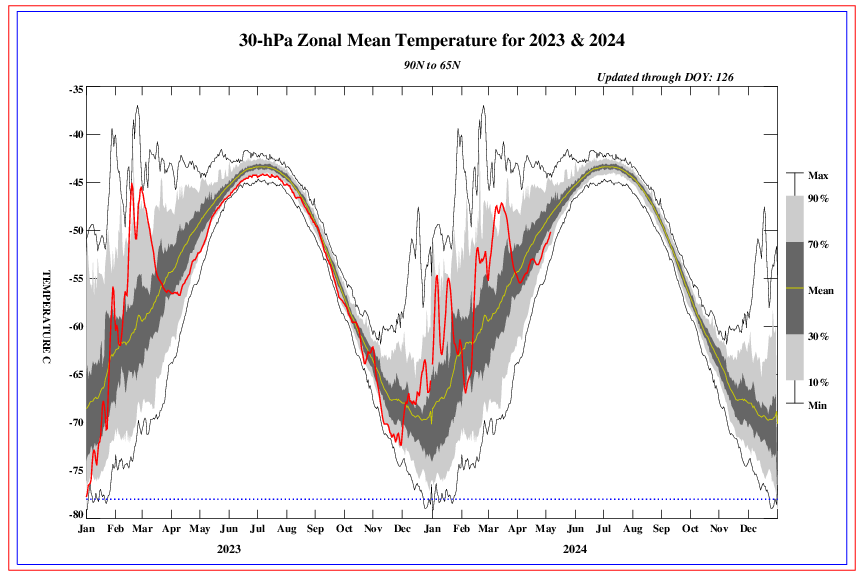
30hpa
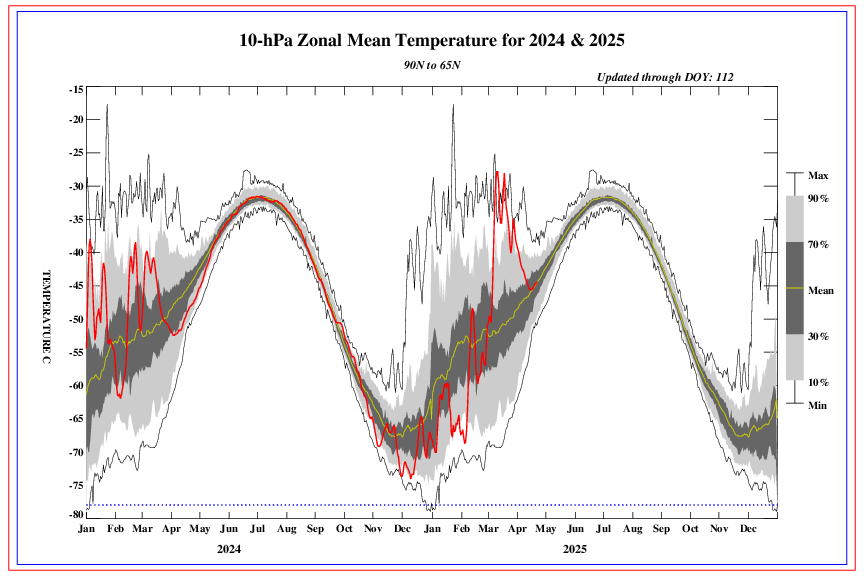
10hpa
Sea Temperatures Anomalies

ENSO
http://www.bom.gov.au/climate/enso/outlook/

Southern Oscillation Index (SOI)

Ocean Currents
